
.svg)

.svg)
Smart Construction solutions
Dashboard
Construction contractors don’t struggle because they lack data — they struggle because it’s scattered, delayed or hard to act on, leading to missed targets, rising costs and frustration.
Smart Construction Dashboard brings it all together in one place — combining design files, daily machine as-built data and drone flight data into a near real-time view of your jobsite. Measure stockpiles, analyze cut and fill, track progress and compare plan versus actual with ease.
Get clear, actionable insight to make faster decisions and keep your projects on track.
The Smart Construction Advantage package bundles Dashboard with Smart Construction Remote and other solutions at a compelling package price. <<Learn more>>

Visualize your data for actionable results
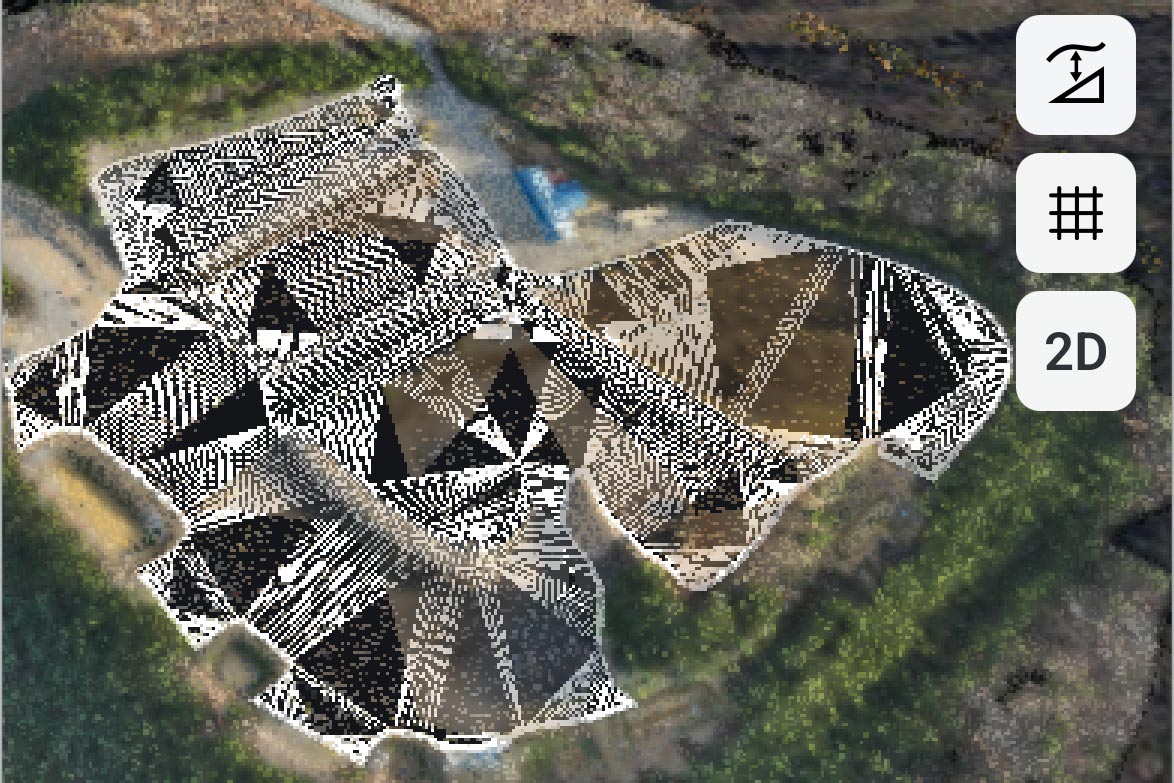
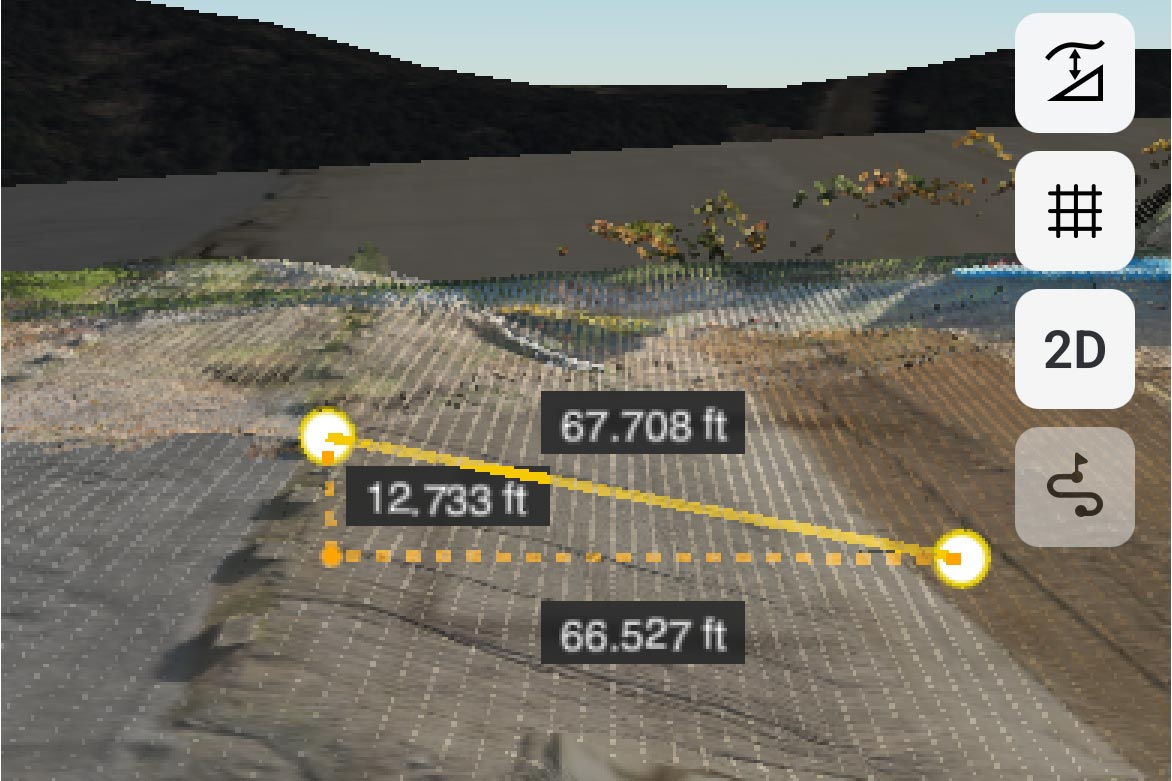
Visualize your data and know where you are today to measure and make decisions on where you want to be tomorrow. By combining 3D design data with aerial mapping and intelligent machine data, you can confirm quantities and see progress each day.
-
 Confirm pre-bid topographical map is correct
-
Track project job site progress in near real time
-
Document site conditions as evidence for change orders
-
Quickly and easily measure stockpile quantities
Features and benefits


Take Smart Construction Dashboard into the field
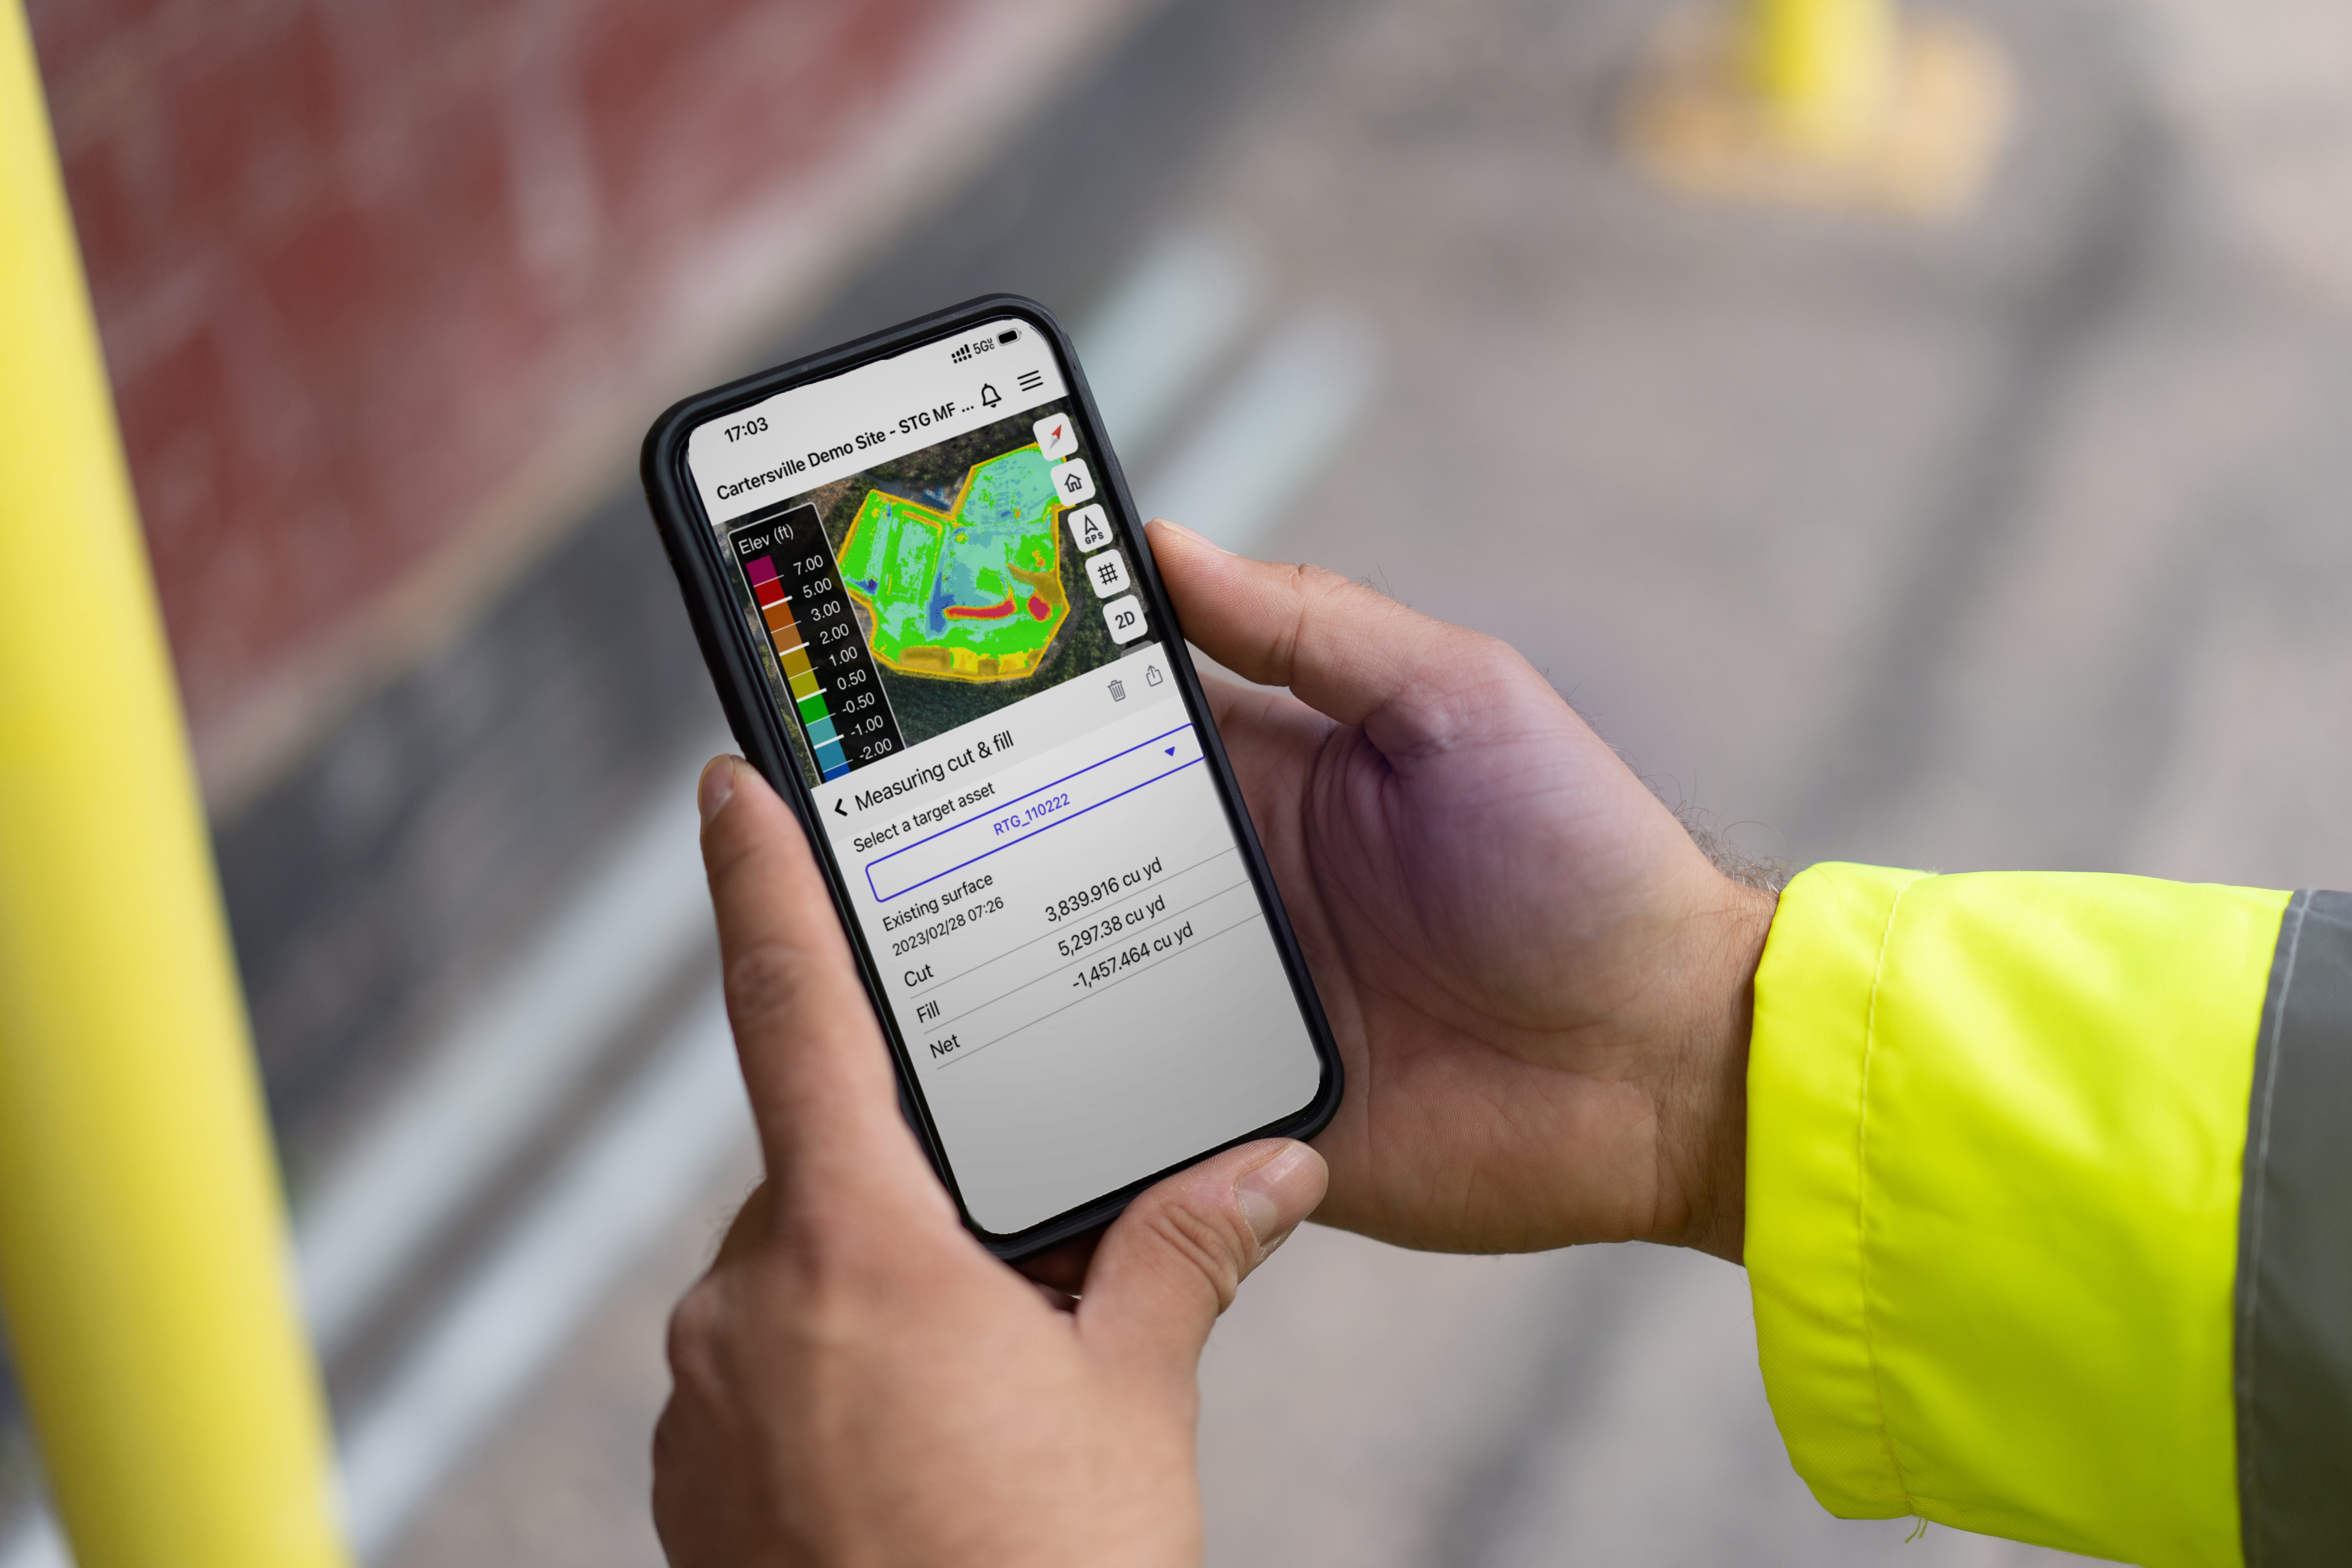
With the Smart Construction Dashboard Mobile app, take the insights from Dashboard nearly anywhere you go. (Available as an add-on subscription.)
Support you can count on
Learn more about our Smart Construction solutions