Smart Construction solutions
Dashboard
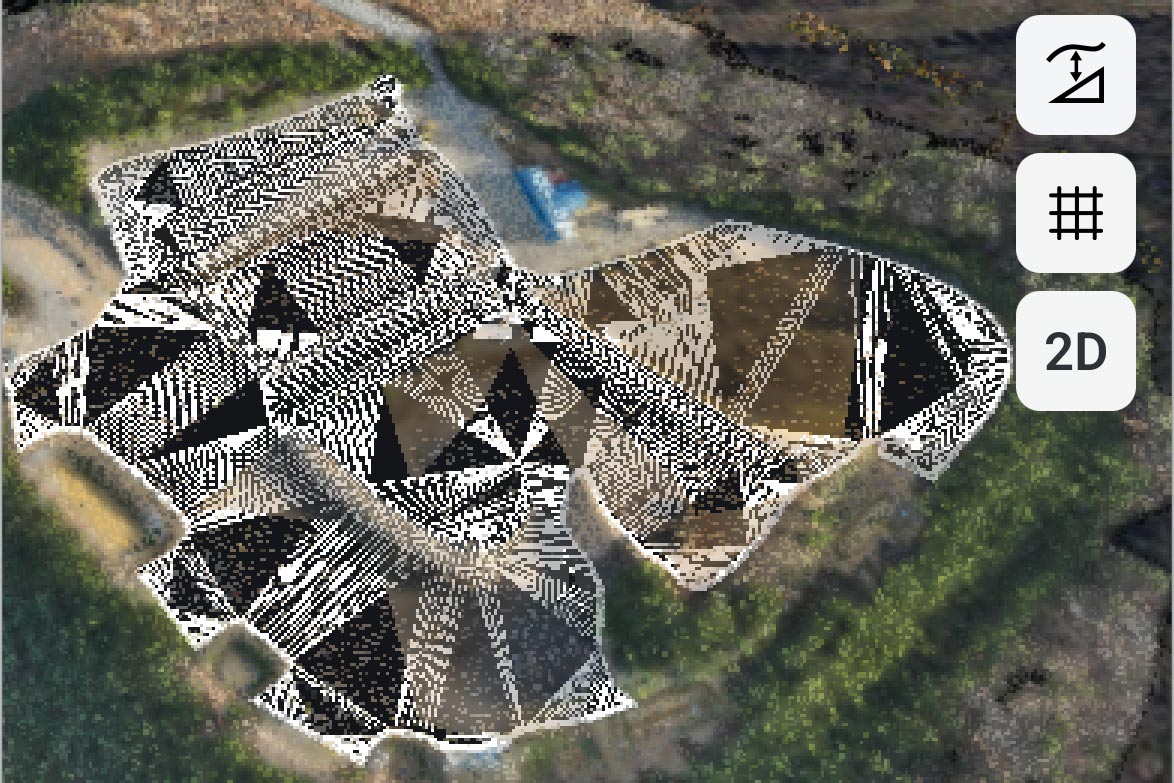
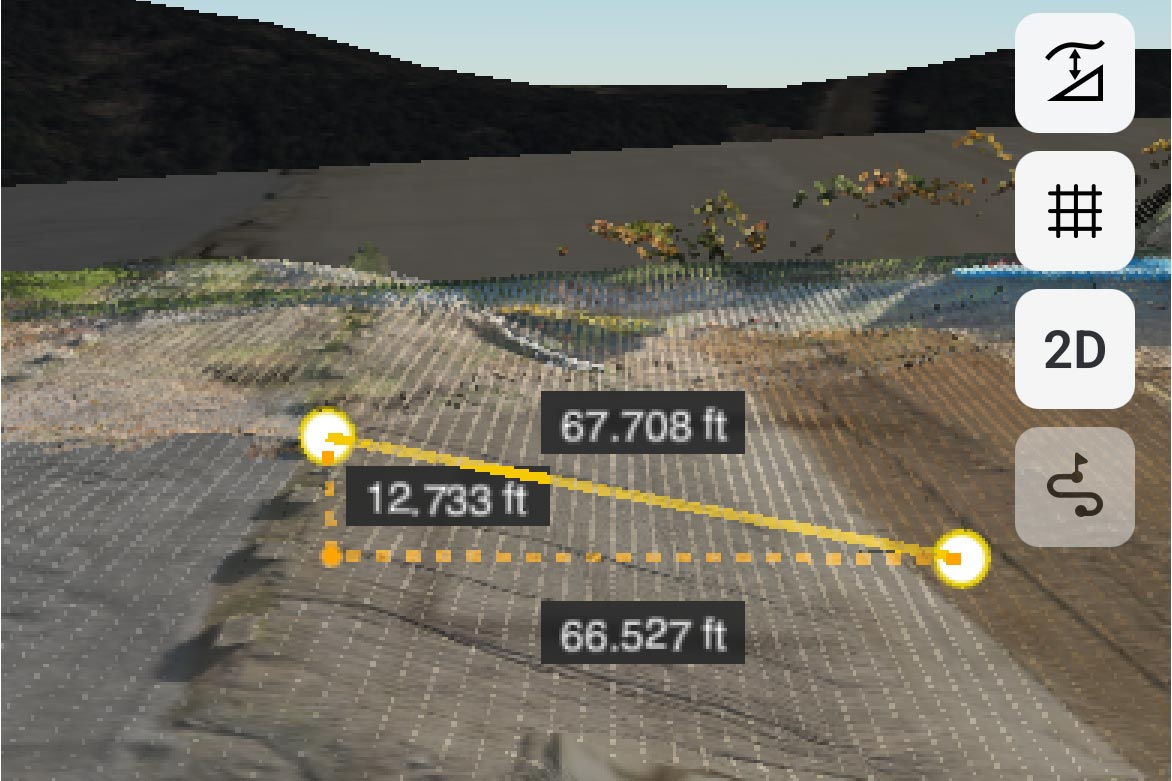
Knowing where you are today by ingesting the various 3D data streams allows you to measure and make decisions on where you want to be tomorrow. By combining the 3D design data with aerial mapping and intelligent machine data, you can confirm quantities and visualize progress. Do you have a stockpile you captured with the drone and want to know the volume? Simply click around the perimeter and get your quantity. Want to calculate the cut/fill of the site, design vs. actual, and print out a color-coded grid map — can do. Spin or rotate the model to gain new perspectives. Dashboard is designed to be used daily by the contractor’s ops team as the go-to solution for visualizing the status of the site.
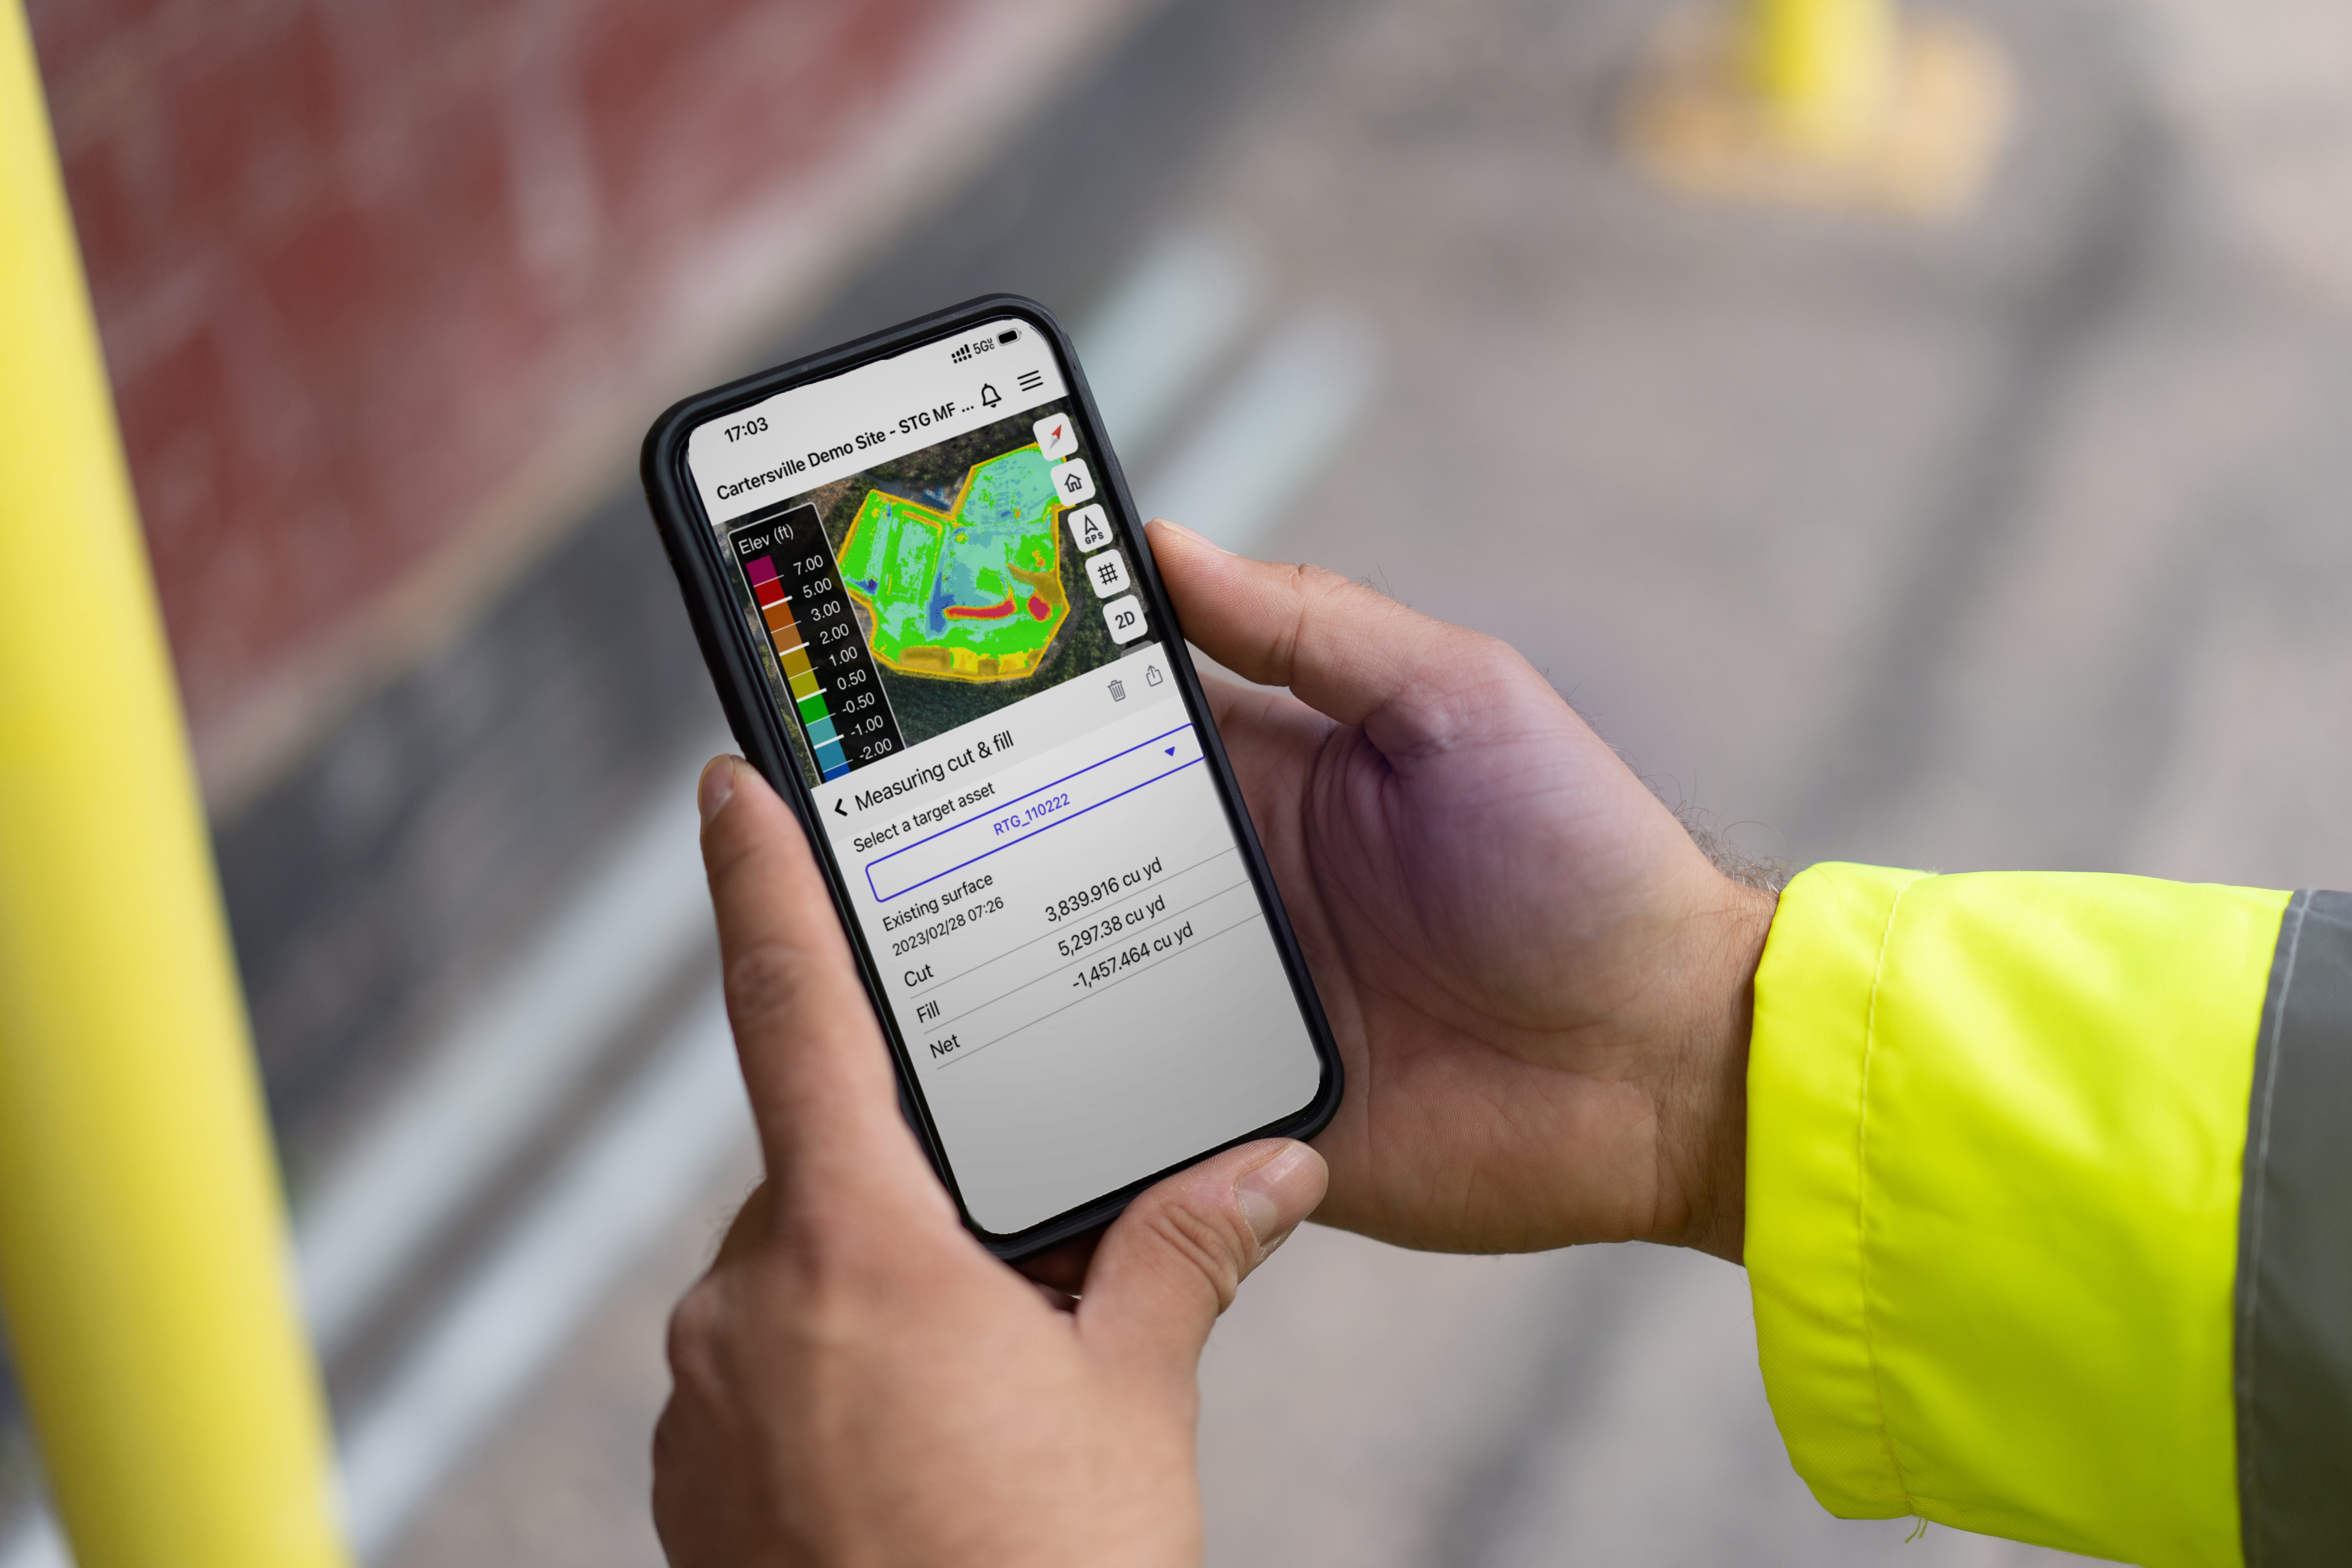
And now you can have most of this information in the palm of your hand with the addition of Smart Construction Dashboard Mobile

Visualize your data for actionable results
Visualize your data and know where you are today to measure and make decisions on where you want to be tomorrow. By combining 3D design data with aerial mapping and intelligent machine data, you can confirm quantities and see progress each day.
-
 Confirm pre-bid topographical map is correct
-
Track project job site progress in near real time
-
Document site conditions as evidence for change orders
-
Quickly and easily measure stockpile quantities
Features and benefits


Take Smart Construction Dashboard into the field
With the Smart Construction Dashboard Mobile app, take the insights from Dashboard nearly anywhere you go. (Available as an add-on subscription.)
Support you can count on
Learn more about our Smart Construction solutions